IC Markets Home Sign in Web Trader Contact Us
IC Markets Social IC Markets Social

Information Hub for
Serious Traders

  • ABOUT US
  • OPEN LIVE ACCOUNT
  • OPEN DEMO ACCOUNT
  • TRADE NOW
  • VISIT OUR BLOG
IC Markets Social
  • ABOUT US
  • OPEN LIVE ACCOUNT
  • OPEN DEMO ACCOUNT
  • TRADE NOW
  • VISIT OUR BLOG
May 21, 2024North_American_Stocks_ptIC Markets

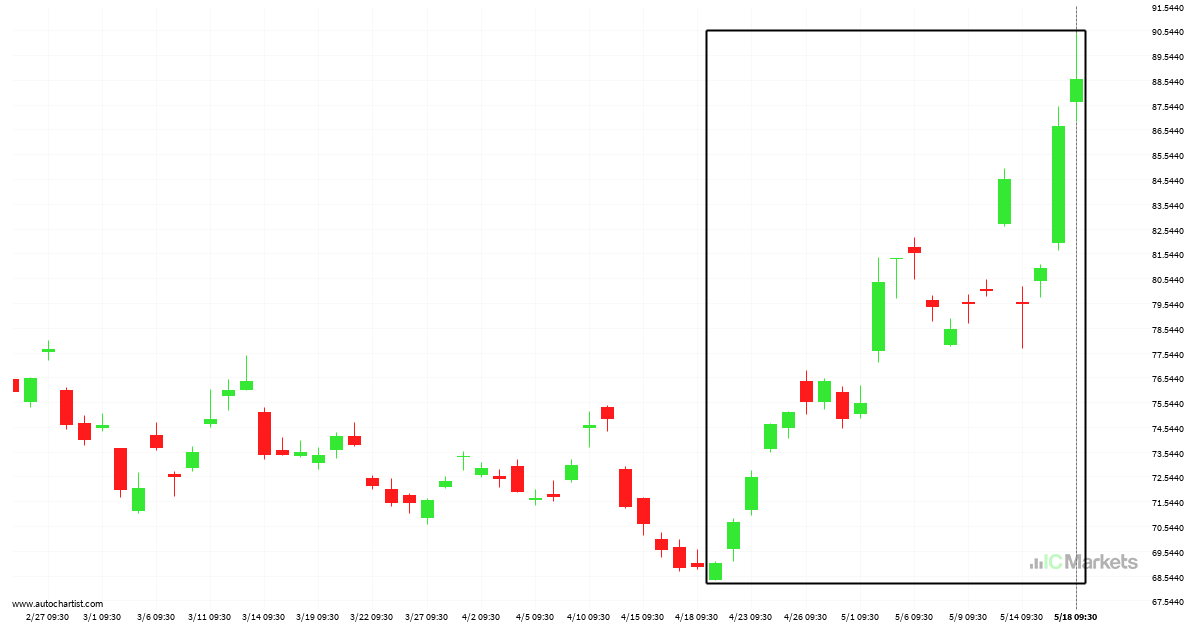
Alibaba Group Holding Limited movendo-se upward, não perca.

Alibaba Group Holding Limited rose acentuadamente por 29 dias – o que é um movimento excessivamente grande para este instrumento; excedendo 98% das movimentações de preço passadas. Mesmo que este movimento seja um sinal de uma nova tendência em Alibaba Group Holding Limited, há uma chance de que testemunhemos uma correção, por mais breve que […]

Read more
May 17, 2024North_American_Stocks_ptIC Markets

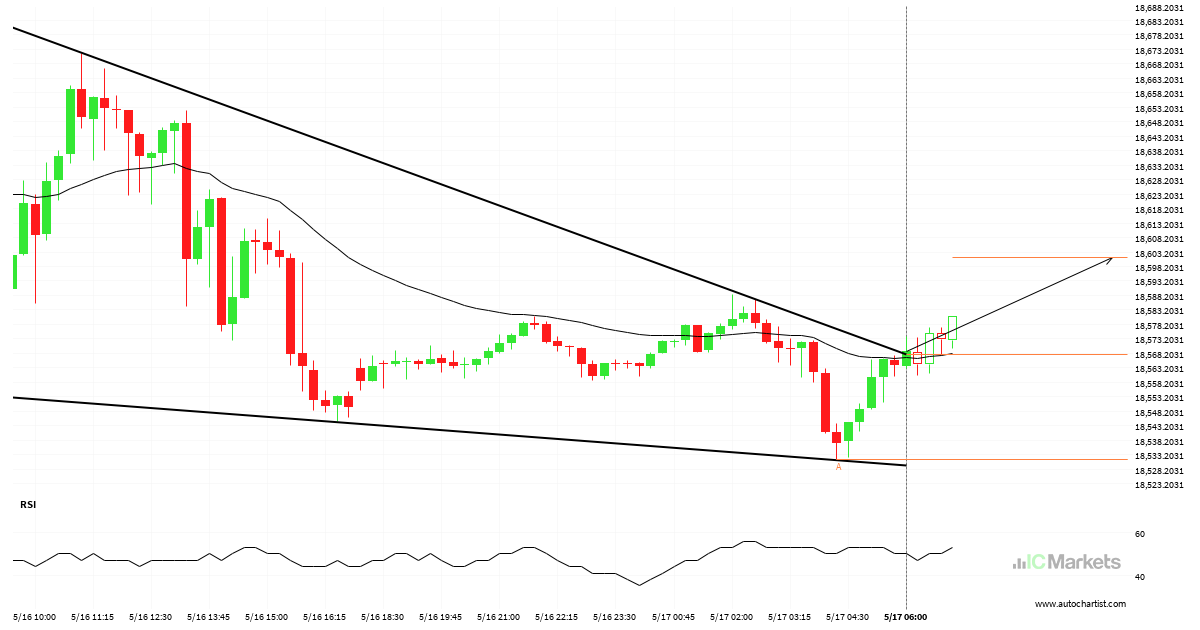
US Tech 100 Index Nível visado: 18601.4387

Cunha descendente quebrou na linha de resistência em 17-mai-2024 06:00 EDT. Possível previsão de movimento em alta nos próximos 5 horas para 18601.4387

Read more
May 16, 2024North_American_Stocks_ptIC Markets

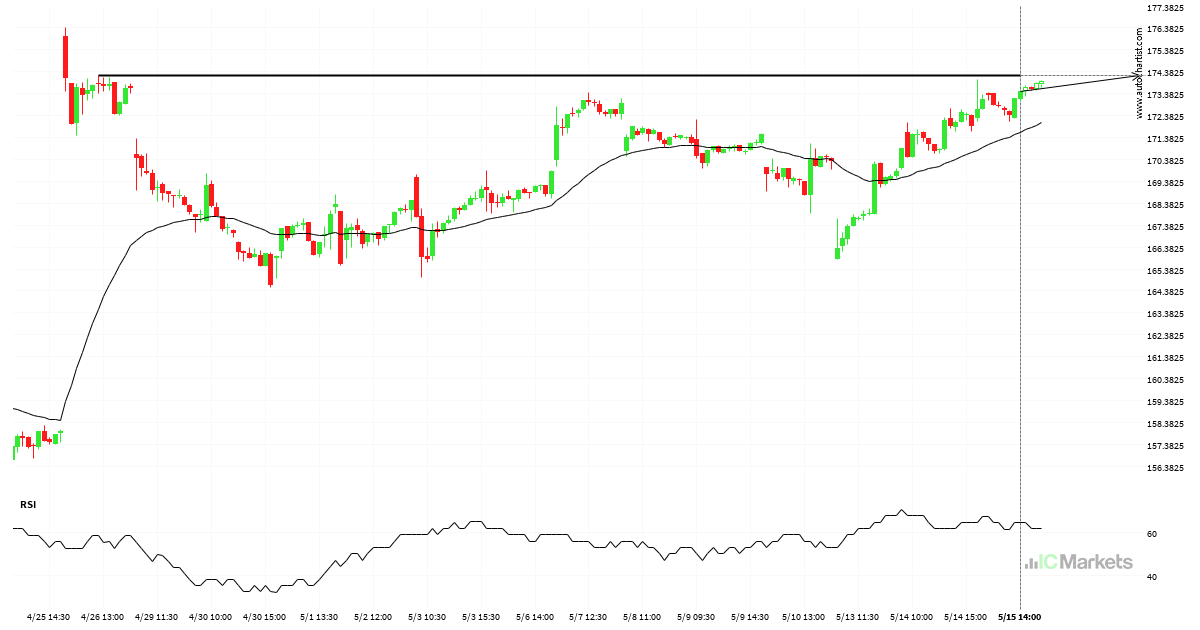
ALPHABET INC CLASS C Nível visado: 174.1950

Aproximando-Resistência nível de 174.1950 identificado em 15-mai-2024 14:00 EDT

Read more
May 9, 2024North_American_Stocks_ptIC Markets

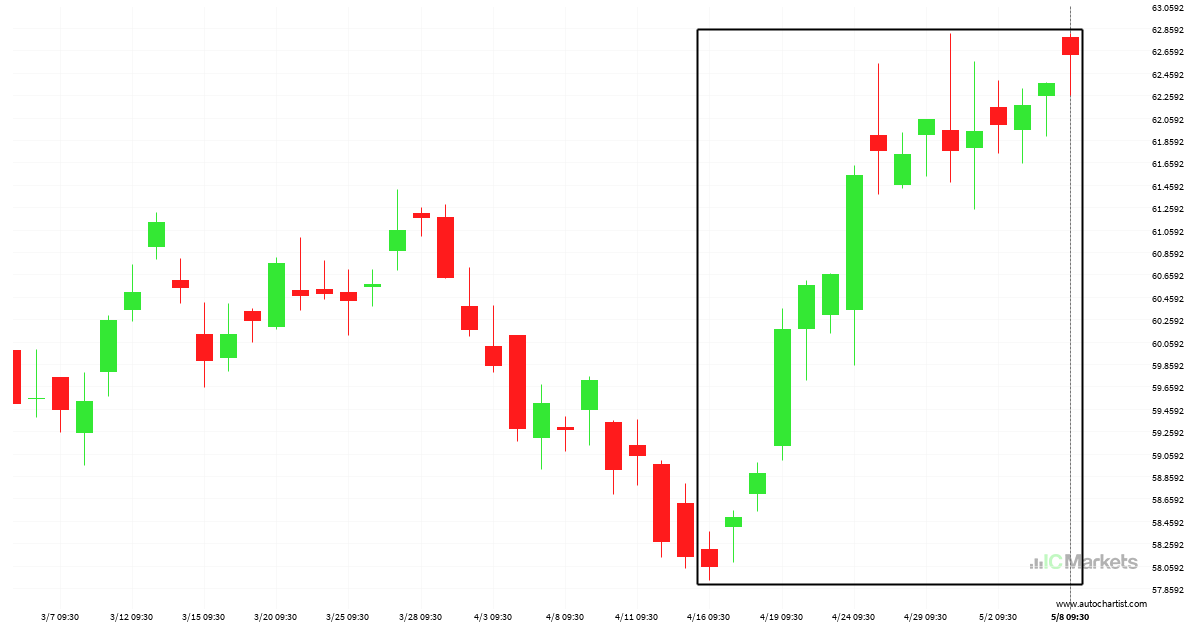
Coca-Cola Co. movendo-se upward, não perca.

Coca-Cola Co. rose acentuadamente por 22 dias – o que é um movimento excessivamente grande para este instrumento; excedendo 98% das movimentações de preço passadas. Mesmo que este movimento seja um sinal de uma nova tendência em Coca-Cola Co., há uma chance de que testemunhemos uma correção, por mais breve que seja.

Read more
May 8, 2024North_American_Stocks_ptIC Markets

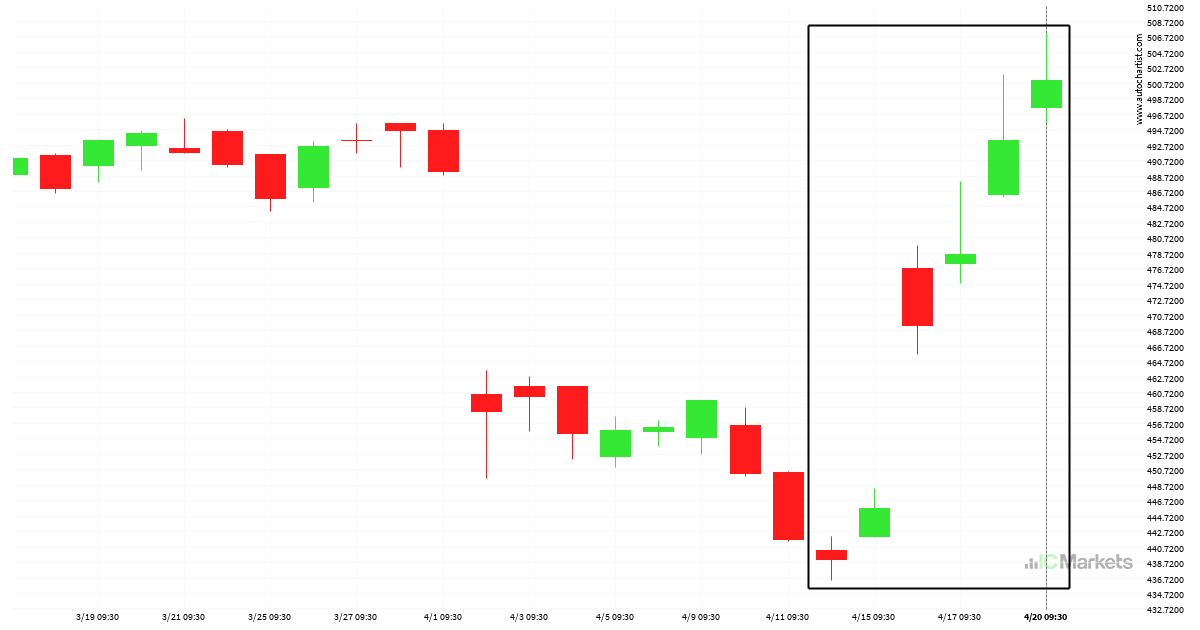
Uma sequência de 6 dias upward em Netflix Inc.

Netflix Inc. rose acentuadamente por 6 dias – o que é um movimento excessivamente grande para este instrumento; excedendo 98% das movimentações de preço passadas. Mesmo que este movimento seja um sinal de uma nova tendência em Netflix Inc., há uma chance de que testemunhemos uma correção, por mais breve que seja.

Read more
May 3, 2024North_American_Stocks_ptIC Markets

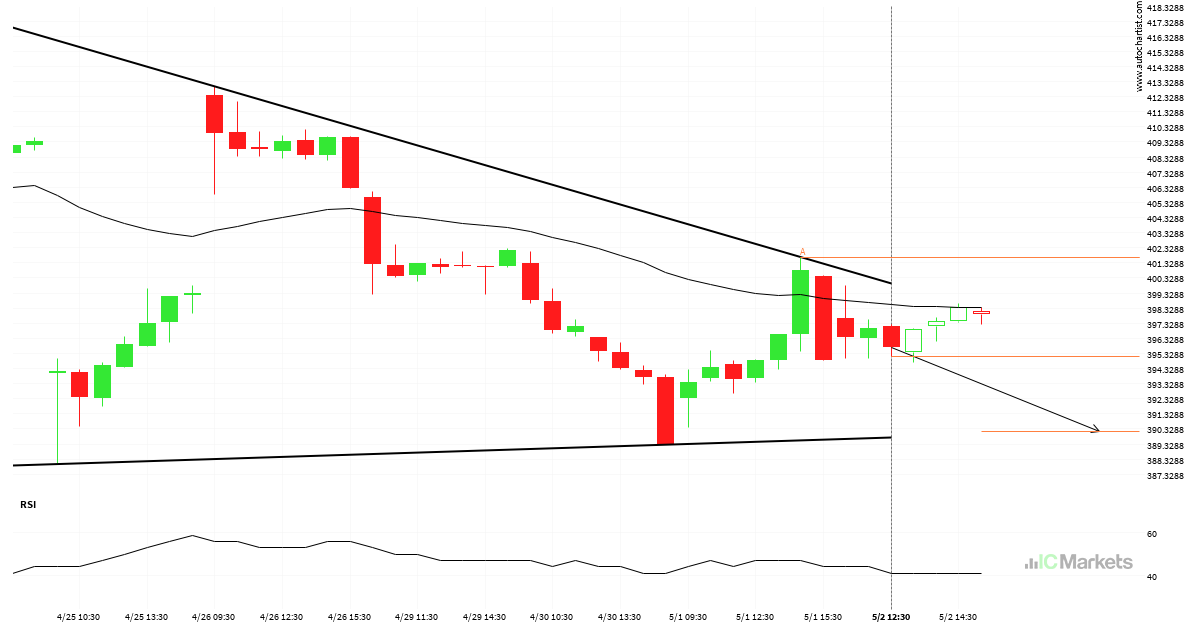
Microsoft Corporation – Continuation Padrão gráfico – Triângulo Descendente

Um Triângulo Descendente emergente foi detectado em Microsoft Corporation no gráfico 1 hora. Há um possível movimento em direção ao 390.1883 nas próximas velas. Uma vez atingindo resistance, pode continuar sua tendência bearish ou reverter para os níveis atuais de preço.

Read more
May 2, 2024North_American_Stocks_ptIC Markets

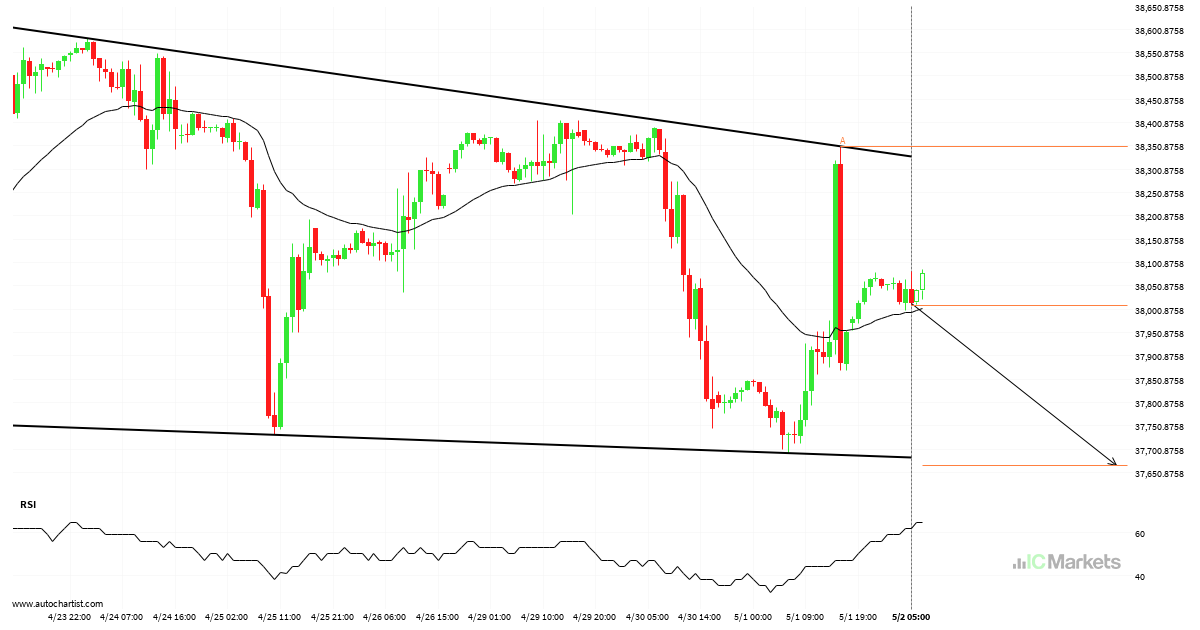
US Wall Street 30 Index – Reversal Padrão gráfico – Triângulo Descendente

Um Triângulo Descendente emergente foi detectado em US Wall Street 30 Index no gráfico 1 hora. Há um possível movimento em direção ao 37666.8282 nas próximas velas. Uma vez atingindo resistance, pode continuar sua tendência bearish ou reverter para os níveis atuais de preço.

Read more
April 25, 2024North_American_Stocks_ptIC Markets

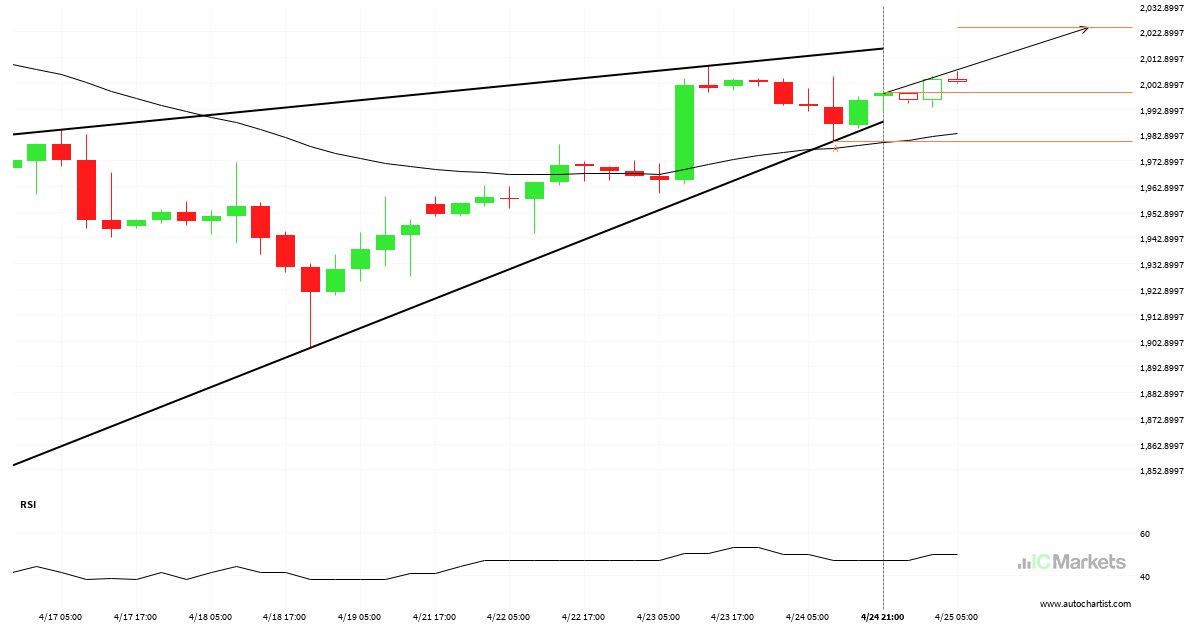
US Small Cap 2000 Index – Continuation Padrão gráfico – Cunha ascendente

Um Cunha ascendente emergente foi detectado em US Small Cap 2000 Index no gráfico 4 hora. Há um possível movimento em direção ao 2024.4162 nas próximas velas. Uma vez atingindo support, pode continuar sua tendência bullish ou reverter para os níveis atuais de preço.

Read more
April 22, 2024North_American_Stocks_ptIC Markets

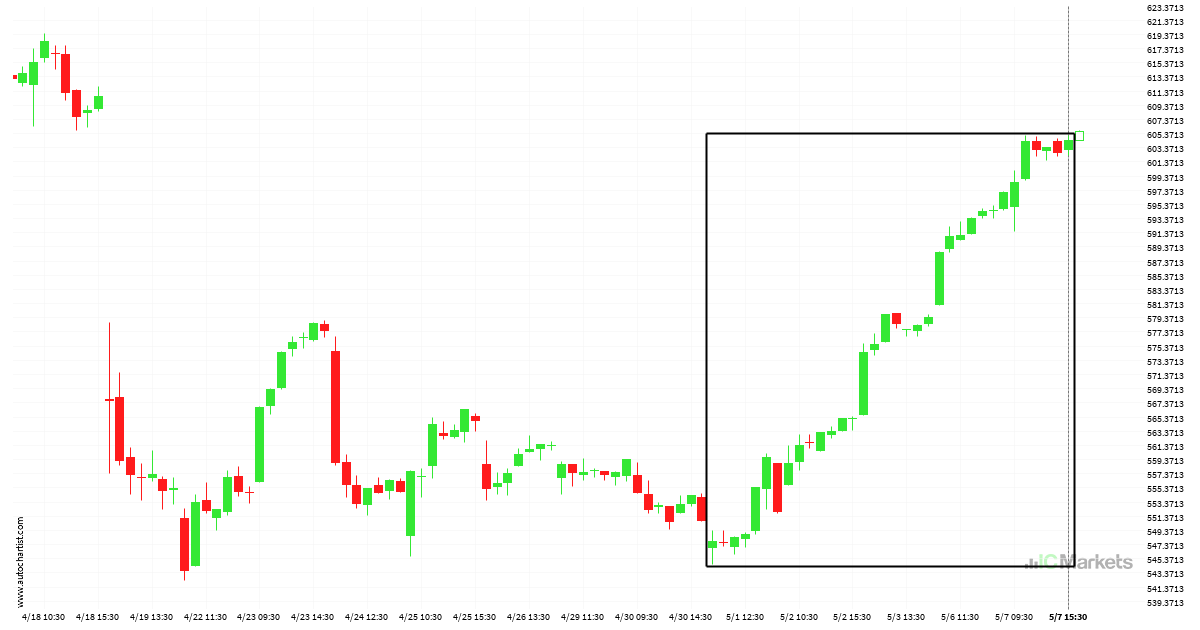
Unitedhealth Group Inc. movendo-se upward, não perca.

Unitedhealth Group Inc. rose acentuadamente por 8 dias – o que é um movimento excessivamente grande para este instrumento; excedendo 98% das movimentações de preço passadas. Mesmo que este movimento seja um sinal de uma nova tendência em Unitedhealth Group Inc., há uma chance de que testemunhemos uma correção, por mais breve que seja.

Read more
April 19, 2024North_American_Stocks_ptIC Markets

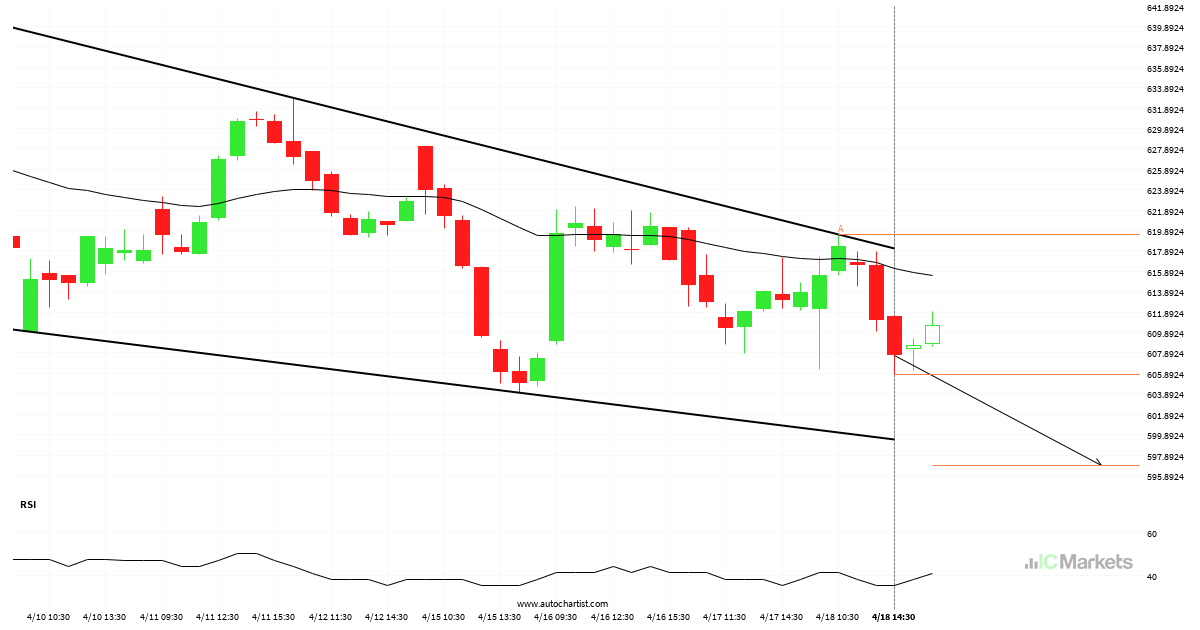
Netflix Inc. – Continuation Padrão gráfico – Cunha descendente

Um Cunha descendente emergente foi detectado em Netflix Inc. no gráfico 1 hora. Há um possível movimento em direção ao 596.9017 nas próximas velas. Uma vez atingindo resistance, pode continuar sua tendência bearish ou reverter para os níveis atuais de preço.

Read more
  • 1
  • 2
  • 3
  • …
  • 12
  • 13
  • 14
  • 15
  • 16
  • 17
  • 18
  • …
  • 87
  • 88
  • 89

Recent Posts

  • Hong Kong 50 Index – รูปแบบกราฟ – สามเหลี่ยมขาขึ้น
  • Hong Kong 50 Index – نموذج الرسم البياني – مثلث صاعد
  • Germany 30 Index – ระดับสำคัญ – แนวรับ
  • Germany 30 Index – المستوى الرئيسي – سند
  • Hong Kong 50 Index – المستوى الرئيسي – مقاومة

Recent Comments

    Translation


     Edit Translation

    Trade with

    a market leader you can rely on

    Open Trading Account Try a Free Demo

    Forex Trading

    • Accounts Overview
    • Open an Account
    • Launch Web Trader

    Trading Specifications

    • Spreads and Commissions
    • Range of Market
    • Trading Hours
    • Funding
    • Withdrawal

    About IC Markets

    • Help Center
    • Why IC Markets
    • Regulation
    • Legal Documents
    • Contact Us


    Forex Trading

    • Accounts Overview
    • Open an Account
    • Launch Web Trader

    Trading Specifications

    • Spreads and Commissions
    • Range of Market
    • Trading Hours
    • Funding
    • Withdrawal

    About IC Markets

    • Chat with a Specialist 24/7
    • Why IC Markets
    • Regulation
    • Legal Documents
    • Contact Us

    Disclaimer: This material is marketing material where all marketing material is published for informational purposes only. This material does not contain and should not be considered as containing - investment advice and recommendations, or suggestions for performing any actions with financial instruments. The built-in widgets belong to their external independent authors, and IC Markets is not responsible for their content and their impact on trade.

    All content rights reserved. Opinions of the authors may not coincide with the opinion of the blog editors. When copying materials from this site or connecting to an RSS feed to republish our articles, a link to IC Markets or attribution in the format ‘IC Markets Blog’ is required. For general questions, please contact the editorial office via the form on the Contact us page.

    Risk Warning: Trading Derivatives carries a high level of risk to your capital and you should only trade with money you can afford to lose. Trading Derivatives may not be suitable for all investors, so please ensure that you fully understand the risks involved and seek independent advice if necessary. A Product Disclosure Statement (PDS) should be considered before entering into a transaction with us.

    The contents of this page are general information only and does not take into account your personal situation, financial objectives or needs. It is up to you to make sure the products that we offer suit your specific needs. You should not trade with us unless you understand the features and risks of the products that we offer. This means that you might need to seek independent advice before you start trading with us.

    © 2022 Raw Trading Ltd | All rights reserved.
    • Sample Page